Varied parameter
Income tax rate
0% → 30%
See how different income tax rates affect your long-term financial outcomes.
This simulation varies a single parameter while keeping all other assumptions constant.
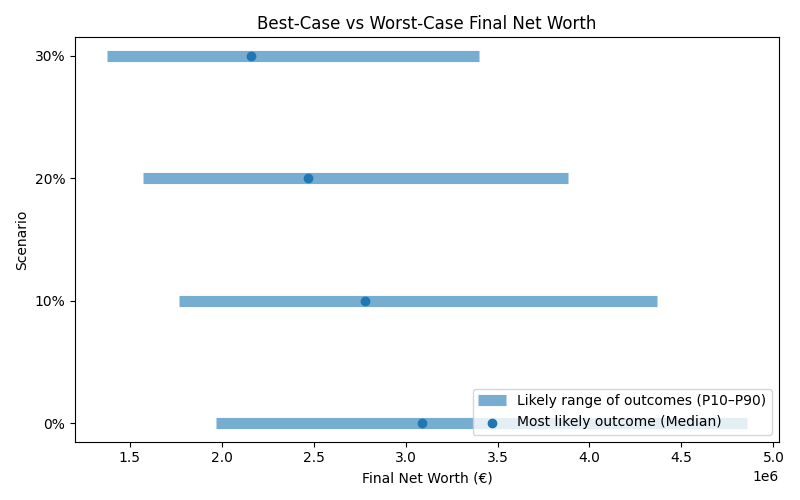
Results are shown as a realistic range. P10 represents a pessimistic outcome (bad years, poor returns), while P90 represents an optimistic outcome (strong markets, good timing). Most simulations fall between these two values.
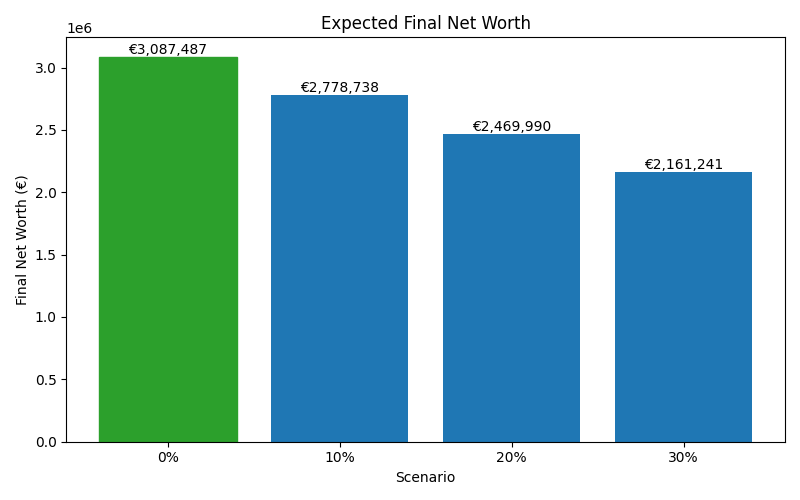
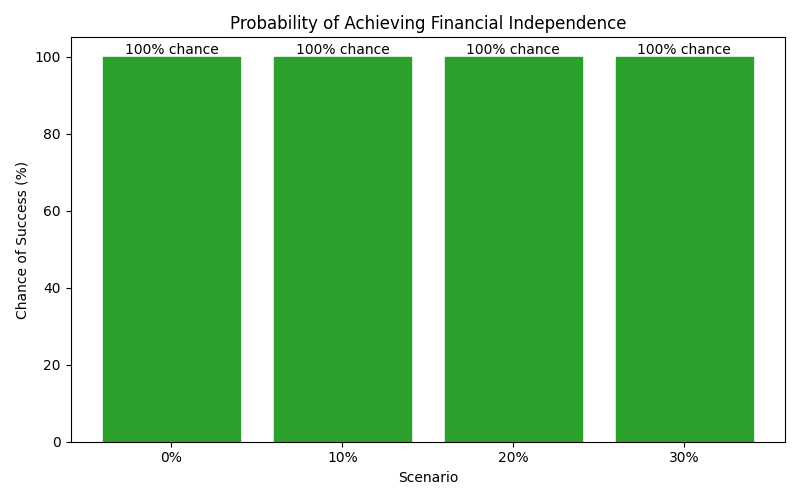
| Scenario | Median Net Worth | P10 Net Worth | P90 Net Worth | FI Probability | FI Median Age |
|---|---|---|---|---|---|
| 0% | 3,087,487.065 | 1,967,008.967 | 4,855,196.484 | 100% | 41 |
| 10% | 2,778,738.3600000003 | 1,770,308.071 | 4,369,676.836 | 100% | 41 |
| 20% | 2,469,989.6550000003 | 1,573,607.175 | 3,884,157.1870000004 | 100% | 42 |
| 30% | 2,161,240.9450000003 | 1,376,906.2789999999 | 3,398,637.5390000003 | 100% | 44 |
These charts show how each scenario affects long-term outcomes, including expected wealth, downside risk, and the likelihood of achieving financial independence.
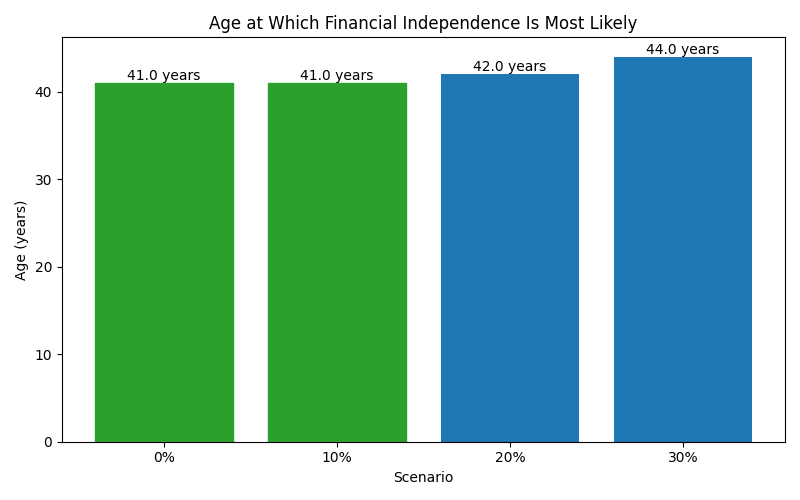
The numbers above translate into real-life trade-offs between risk, reward, and the age at which financial independence becomes most likely.
Want to explore a different assumption or see how sensitive your plan is to change?
🔁 Adjust Income Tax Rate