Varied parameter
Investment return (expected)
3% → 7%
See how different expected investment returns affect your long-term financial outcomes.
This simulation varies a single parameter while keeping all other assumptions constant.
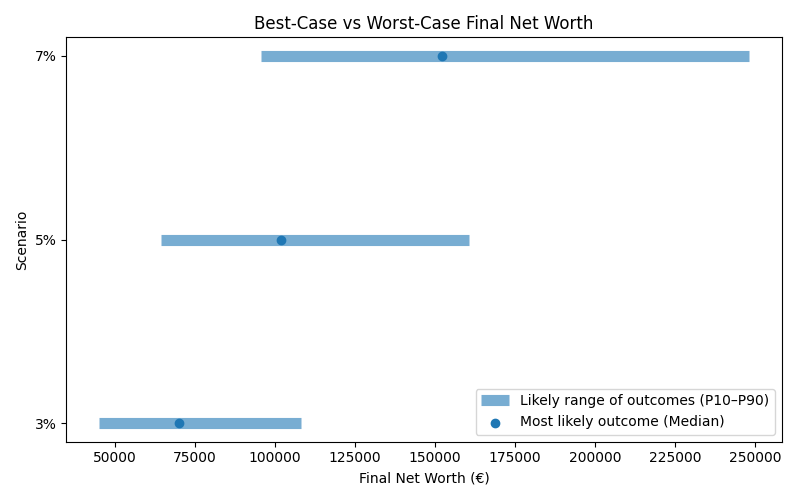
Results are shown as a realistic range. P10 represents a pessimistic outcome (bad years, poor returns), while P90 represents an optimistic outcome (strong markets, good timing). Most simulations fall between these two values.
| Scenario | Median Net Worth | P10 Net Worth | P90 Net Worth | FI Probability | FI Median Age |
|---|---|---|---|---|---|
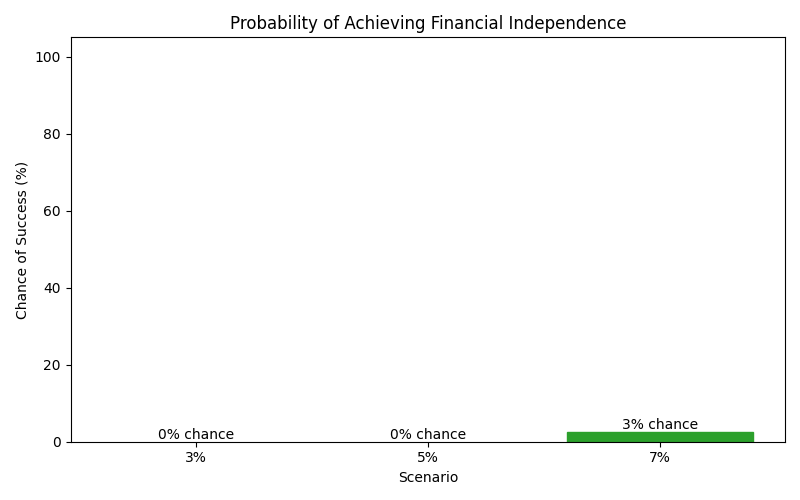
| 3% | 69,905.465 | 44,932.943 | 108,158.686 | 0% | None |
| 5% | 101,739.16 | 64,501.818 | 160,726.23200000002 | 0% | None |
| 7% | 152,220.15999999997 | 95,658.06300000001 | 248,146.288 | 2% | 63 |
These charts show how each scenario affects long-term outcomes, including expected wealth, downside risk, and the likelihood of achieving financial independence.
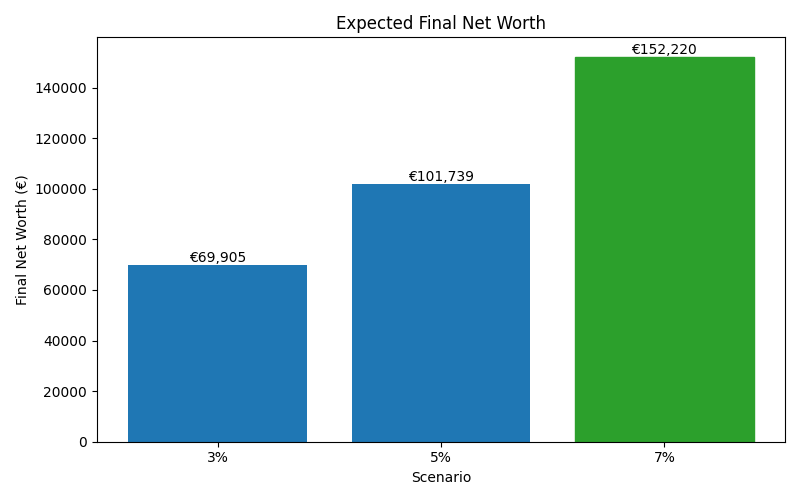
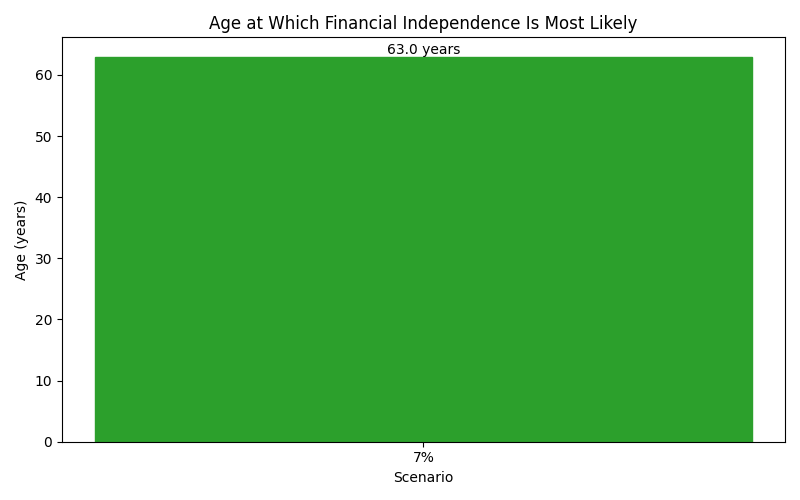
The numbers above translate into real-life trade-offs between risk, reward, and the age at which financial independence becomes most likely.
Want to explore a different assumption or see how sensitive your plan is to change?
🔁 Adjust Investment Return