Varied parameter
Income tax rate
0% → 30%
See how different income tax rates affect your long-term financial outcomes.
This simulation varies a single parameter while keeping all other assumptions constant.
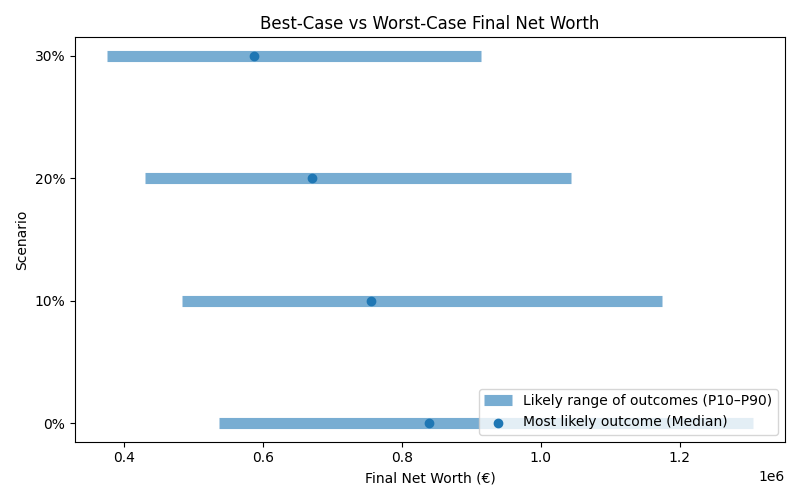
Results are shown as a realistic range. P10 represents a pessimistic outcome (bad years, poor returns), while P90 represents an optimistic outcome (strong markets, good timing). Most simulations fall between these two values.
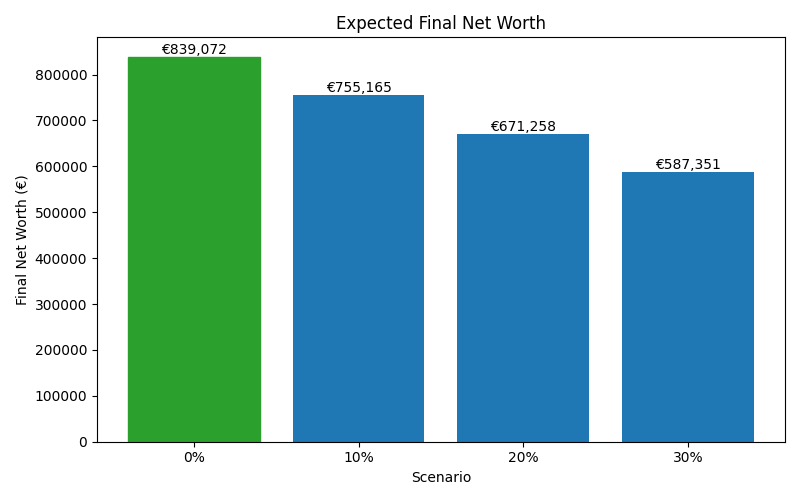
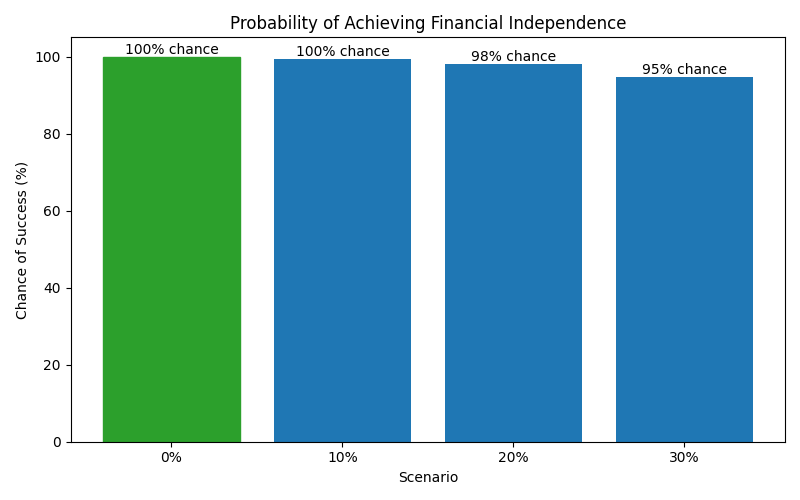
| Scenario | Median Net Worth | P10 Net Worth | P90 Net Worth | FI Probability | FI Median Age |
|---|---|---|---|---|---|
| 0% | 839,072.4850000001 | 537,351.29 | 1,305,295.398 | 99% | 53 |
| 10% | 755,165.24 | 483,616.169 | 1,174,765.8590000002 | 99% | 54 |
| 20% | 671,257.99 | 429,881.039 | 1,044,236.32 | 98% | 55 |
| 30% | 587,350.74 | 376,145.909 | 913,706.7810000001 | 94% | 57 |
These charts show how each scenario affects long-term outcomes, including expected wealth, downside risk, and the likelihood of achieving financial independence.
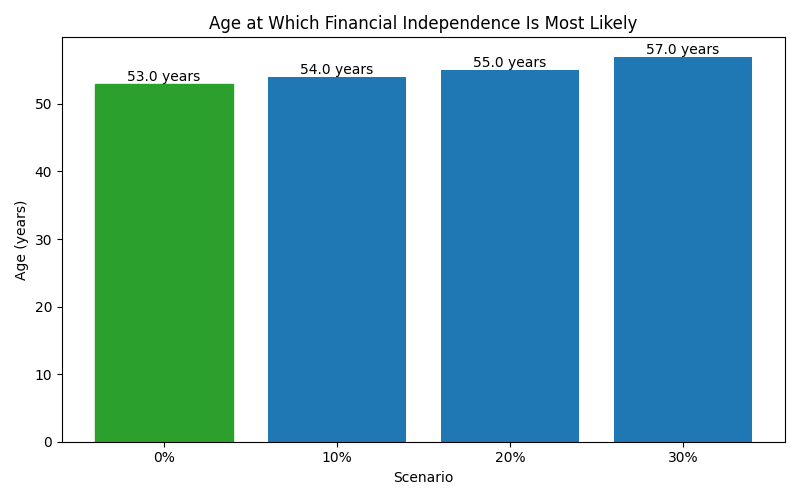
The numbers above translate into real-life trade-offs between risk, reward, and the age at which financial independence becomes most likely.
Want to explore a different assumption or see how sensitive your plan is to change?
🔁 Adjust Income Tax Rate