Varied parameter
Saving rate
5% → 25%
See how different saving rates affect your long-term financial outcomes.
This simulation varies a single parameter while keeping all other assumptions constant.
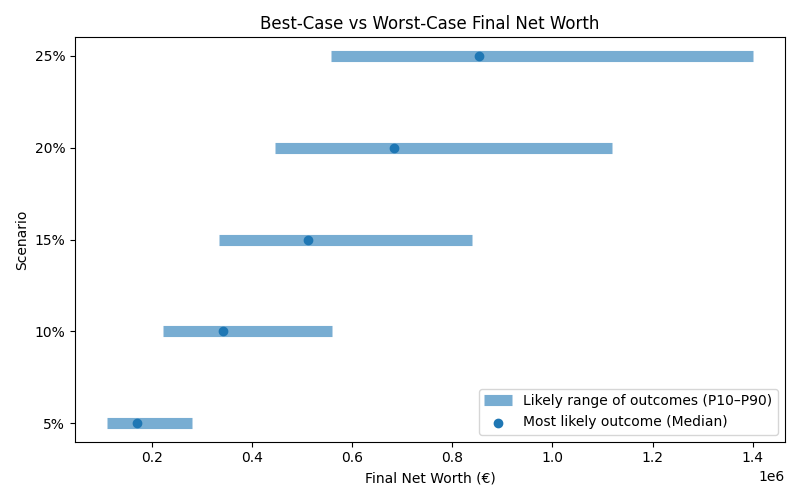
Results are shown as a realistic range. P10 represents a pessimistic outcome (bad years, poor returns), while P90 represents an optimistic outcome (strong markets, good timing). Most simulations fall between these two values.
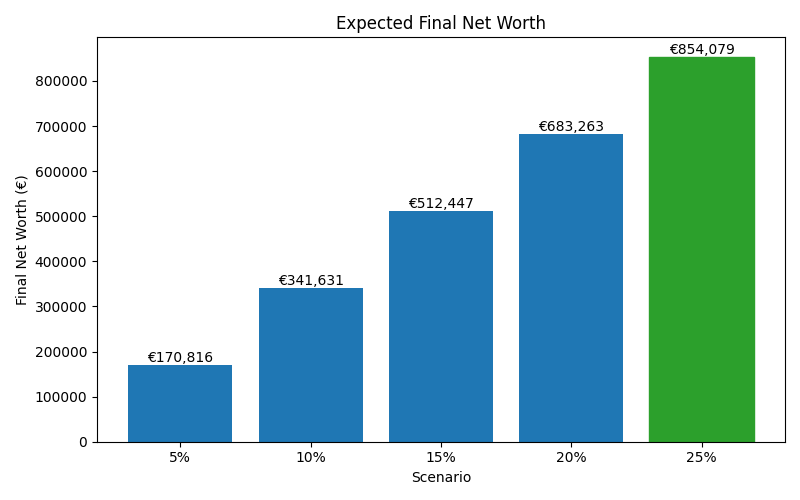
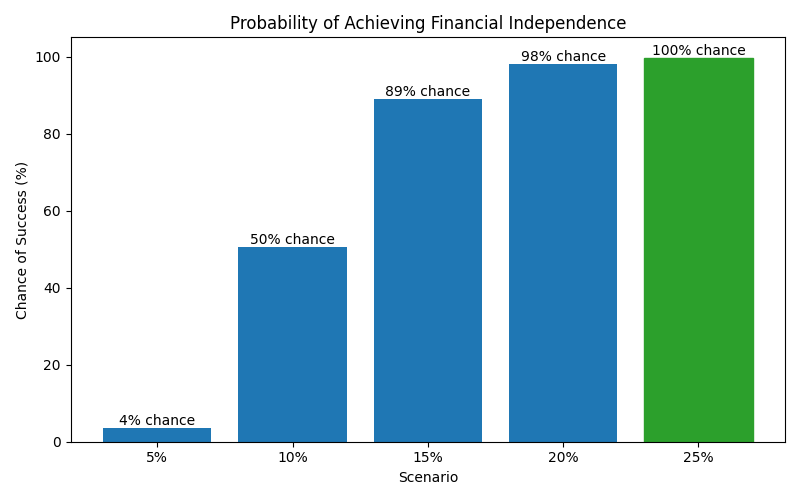
| Scenario | Median Net Worth | P10 Net Worth | P90 Net Worth | FI Probability | FI Median Age |
|---|---|---|---|---|---|
| 5% | 170,815.71000000002 | 111,596.3 | 279,968.87 | 3% | 63 |
| 10% | 341,631.42000000004 | 223,192.592 | 559,937.74 | 50% | 61 |
| 15% | 512,447.13 | 334,788.892 | 839,906.6089999999 | 89% | 58 |
| 20% | 683,262.8400000001 | 446,385.192 | 1,119,875.479 | 98% | 55 |
| 25% | 854,078.5549999999 | 557,981.493 | 1,399,844.3490000002 | 99% | 52 |
These charts show how each scenario affects long-term outcomes, including expected wealth, downside risk, and the likelihood of achieving financial independence.
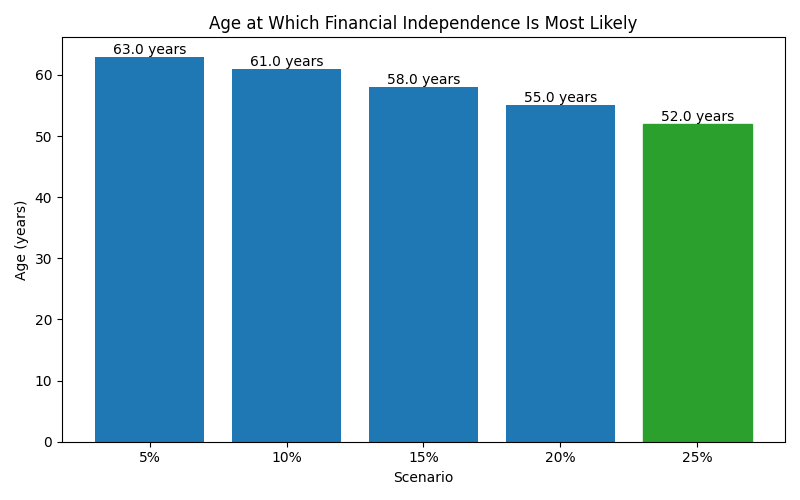
The numbers above translate into real-life trade-offs between risk, reward, and the age at which financial independence becomes most likely.
Want to explore a different assumption or see how sensitive your plan is to change?
🔁 Adjust Saving Rate