Income Growth Comparison

See how different income growth assumptions affect your long-term financial outcomes.

Simulation Overview

This simulation varies a single parameter while keeping all other assumptions constant.

Base scenario assumptions

  • The simulation starts at age 30 and runs until age 65.
  • The initial annual income is โ‚ฌ32,000.
  • Income grows annually at an average rate of 3%.
  • An income tax rate of 10% is applied to gross income.
  • The saving rate is set to 20%.
  • Minimum annual living expenses are โ‚ฌ14,000.
  • Savings are invested with stochastic annual returns.
  • The average annual return is 5%, with year-to-year variability.
  • All values are expressed in real terms, assuming average annual inflation of 2%.
  • The simulation includes stochastic life events such as unemployment, health issue, and unemployment.
  • These events may temporarily affect income, expenses, or net worth.
  • Financial independence is defined as having net worth equal to 25 times annual expenses.
  • Bankruptcy is triggered if net worth remains below โ‚ฌ0 for 2 consecutive years.
๐Ÿ”
Varied parameter
Income growth (annual) 1% โ†’ 5%

Scenario Comparison

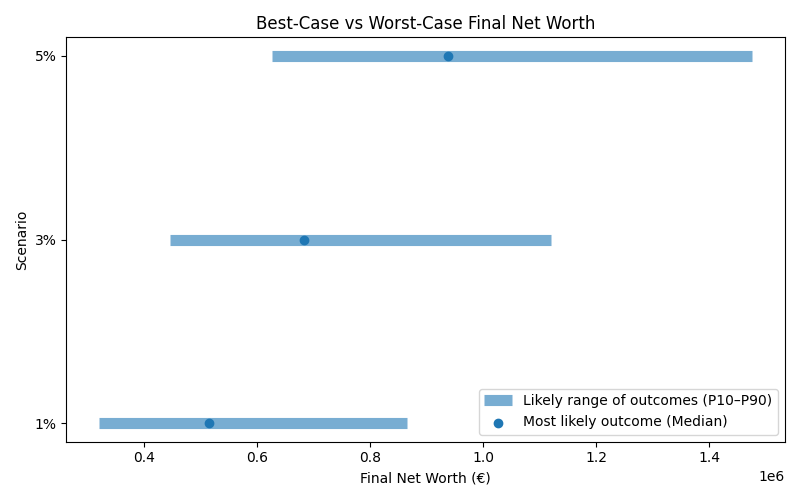
Results are shown as a realistic range. P10 represents a pessimistic outcome (bad years, poor returns), while P90 represents an optimistic outcome (strong markets, good timing). Most simulations fall between these two values.
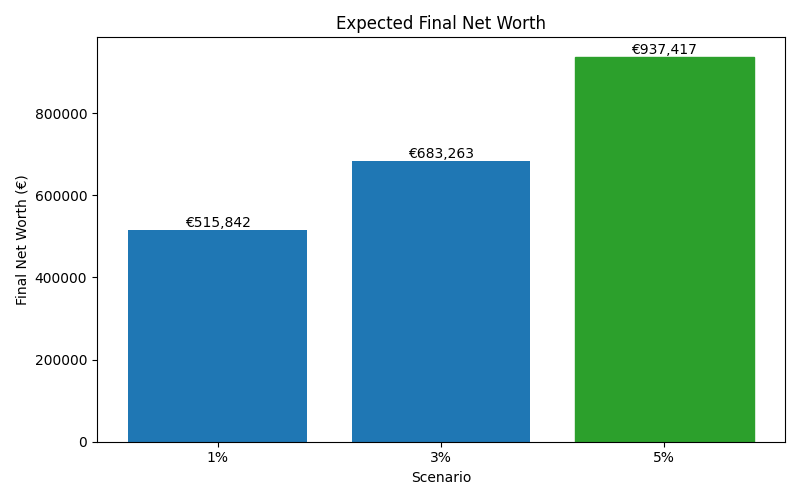
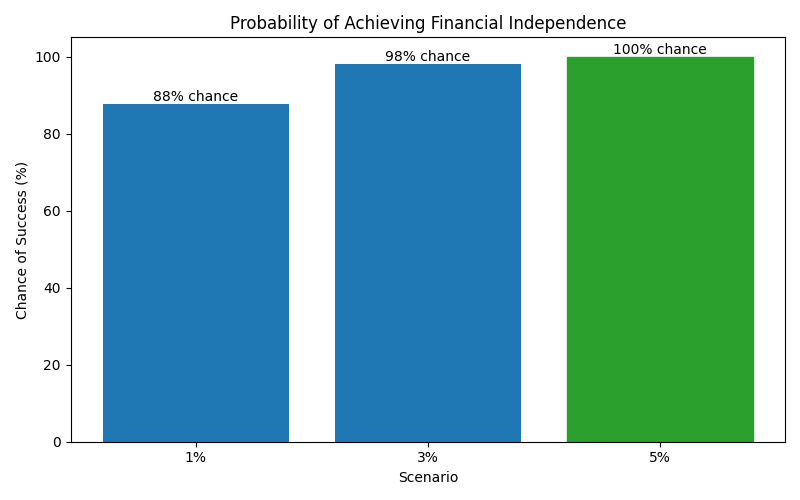
ScenarioMedian Net WorthP10 Net WorthP90 Net WorthFI ProbabilityFI Median Age
1% 515,841.505 320,496.277 865,821.9050000001 87% 57
3% 683,262.8400000001 446,385.192 1,119,875.479 98% 55
5% 937,417.2050000001 625,893.334 1,475,938.718 100% 52

How Your Financial Life Evolves

These charts show how each scenario affects long-term outcomes, including expected wealth, downside risk, and the likelihood of achieving financial independence.

Median net worth

Median net worth for different scenarios

Net worth outcome range (p10โ€“p90)

Range of possible net worth outcomes

Financial independence probability

Probability of reaching financial independence

Median age of financial independence

Median age at which financial independence is reached

What This Means for You

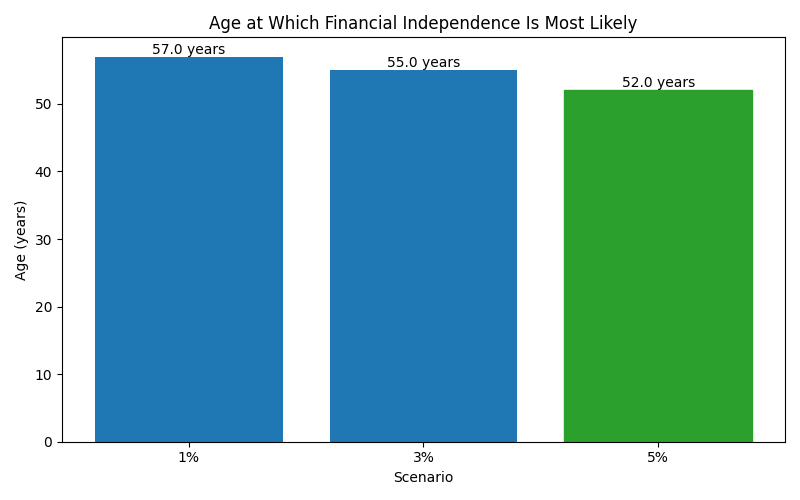
The numbers above translate into real-life trade-offs between risk, reward, and the age at which financial independence becomes most likely.

Next Step

Want to explore a different assumption or see how sensitive your plan is to change?

๐Ÿ” Adjust Income Growth